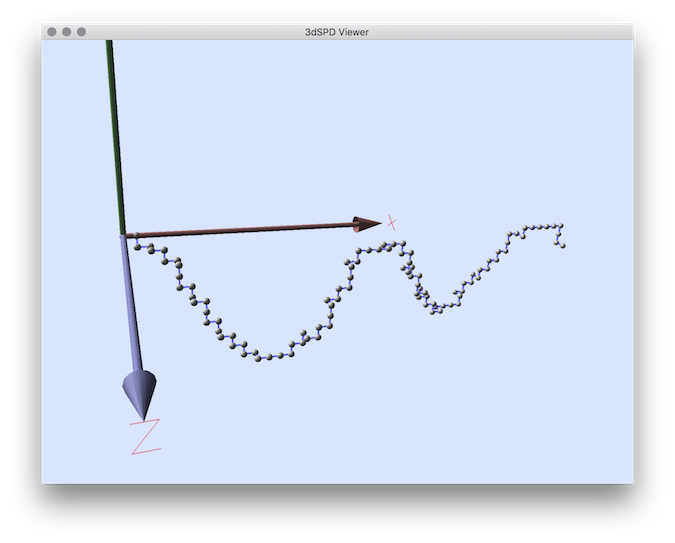
Displays a sequence of 3d discrete points by using QGLviewer.
-h [ --help ] display this message
-i [ --input ] arg input file: sdp (sequence of discrete
points)
--SDPindex arg specify the sdp index (by default
0,1,2).
-c [ --pointColor ] arg set the color of points: r g b a
-l [ --lineColor ] arg set the color of line: r g b a
-m [ --addMesh ] arg append a mesh (off/obj) to the point
set visualization.
--customColorMesh arg set the R, G, B, A components of the
colors of the mesh faces (mesh added
with option --addMesh).
--importColors import point colors from the input file
(R G B colors should be by default at
index 3, 4, 5).
--importColorLabels import color labels from the input file
(label index should be by default at
index 3).
--setColorsIndex arg customize the index of the imported
colors in the source file (used by
-importColor).
--setColorLabelIndex arg (=3) customize the index of the imported
color labels in the source file (used
by -importColorLabels).
-f [ --filter ] arg (=100) filter input file in order to display
only the [arg] pourcent of the input 3D
points (uniformly selected).
--noPointDisplay usefull for instance to only display
the lines between points.
--drawLines draw the line between discrete points.
-x [ --scaleX ] arg (=1) set the scale value in the X direction
(default 1.0)
-y [ --scaleY ] arg (=1) set the scale value in the Y direction
(default 1.0)
-z [ --scaleZ ] arg (=1) set the scale value in the Z direction
(default 1.0)
--sphereResolution arg (=30) defines the sphere resolution (used
when the primitive is set to the
sphere). (default resolution: 30)
-s [ --sphereRadius ] arg (=0.20000000000000001)
defines the sphere radius (used when
the primitive is set to the sphere).
(default value 0.2)
--sphereRadiusFromInput takes, as sphere radius, the 4th field
of the sdp input file.
--lineSize arg (=0.20000000000000001) defines the line size (used when the
--drawLines or --drawVectors option is
selected). (default value 0.2))
-p [ --primitive ] arg (=voxel) set the primitive to display the set of
points (can be sphere, voxel (default),
or glPoints (opengl points).
-v [ --drawVectors ] arg SDP vector file: draw a set of vectors
from the given file (each vector are
determined by two consecutive point
given, each point represented by its
coordinates on a single line.
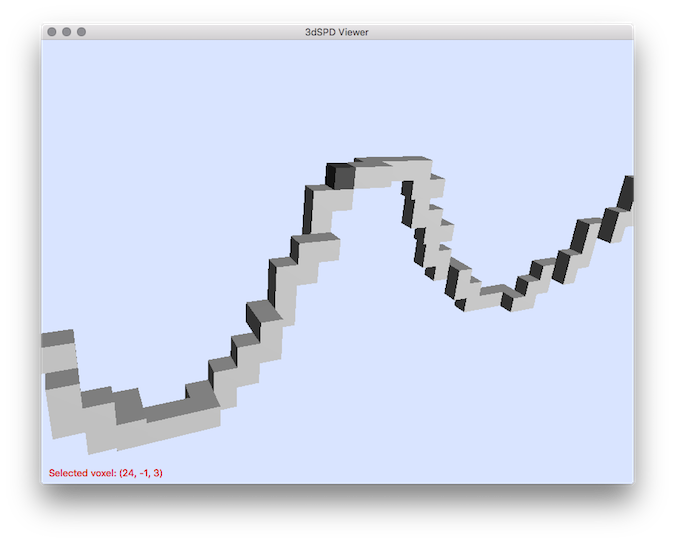
--interactiveDisplayVoxCoords by using this option the pixel
coordinates can be displayed after
selection (shift+left click on voxel).
This tool can be useful to recover coordinates from a set of voxels. To do it, you have to add the option allowing to activate the interactive selection (with –interactiveDisplayVoxCoords), for instance if you apply:
you should be able to select a voxel by using the SHIFT key and by clicking on a voxel:
 1.8.11

